Newport Beach, CA - You gotta love the financial media. The stock pickers, the market watchers. The experts.
They act as if they can see the future.
But they can never seem to put a date on when the future will begin.
Sure the stock market’s going to crash!
We all know it will. It always does – eventually.
But will it be this week, next week, next month – next year?
Well, finally, there’s a way to know.
To absolutely see the coming crash shortly before it arrives – and see it coming with what has been absolute 100% certainty.
And that’s exactly what you’re about to discover today, in this letter.
If you’ve been a student of the markets, you know, historically, the average bull market lasts about 4 years.
The one we’re in now, however… it’s been running ever since the end of the Great Recession almost 9 years ago!
It’s the second longest bull market in American history.
So, of course, it’s going to end!
We all know it will.
It has to. No bull market lasts forever.
But up until today, all we knew for sure was… the longer this bull market continues, even with all its spits and spurts…
The bigger the coming crash could be.
It might even plunge us into another and even bigger recession.
This isn’t rocket science after all. It’s common sense.
It’s like an earthquake…
As ALL Californians know… the more time between earthquakes, the more the pressure down below builds up… and the bigger the next earthquake will be.
Well, it’s the same with the stock market.
Of course, the bobble heads in the financial media want to dress it up into something far more complex.
Economists, for example, will give you scenarios…
They say if this and this happens, or doesn’t happen, then such and such might happen and then the stock market might crash, or not.
Well, gee, thanks for the clarification.
In other words, they don’t know – they don’t have a clue.
But you gotta love it when they speak in “tongues” to make it sound as if they do.
Remember former Fed Chairman Alan Greenspan?
How can you forget?
In all the years he held the chairmanship, no one could figure out what the hell he was saying. But everyone thought he said it brilliantly.
Then, too, there’s those ridiculously over-hyped, over-priced investment newsletters we all subscribe to.
How many have you subscribed to over the years?
They tell you what stocks to buy. And when things don’t pan out (the way they told you it would)… then they tell you to sell.
Well, thanks a bunch!
But I can always lose money on my own. I don’t need their help!
Okay, to be fair, sometimes, not often enough… they pick a winner.
Then there’s the technical analysts…
They love drawing lines on stock charts and showing you where there’s “support” and “resistance.”
Well, at least they try to take a scientific approach.
But they never take their research and analyses far enough.
For example… have you ever bailed on a stock because it broke support – or moved your entire portfolio into bonds because the S&P 500 broke support?
You can raise your hand. Nothing to be ashamed of. We’ve all done it.
And the reason you did it was because the analysts (or your advisor) put the fear of God in you…
They warned you that if you don’t move out of this or that stock – or stocks in general – and support is indeed broken…
“There’ll be hell to pay! With a lot more downside to follow!”
At face value that makes perfect sense.
Well, I never put much stock in face value.
So I actually did some analysis of my own…
Did you know that ever since 1982 – more than 30 years ago – every time the S&P 500 broke support…
It almost immediately reversed course and roared higher 70.66% of the time.
How’s that for a kick in the pants?
Check it out for yourself.
Here’s a recent example, right after the Brexit vote:
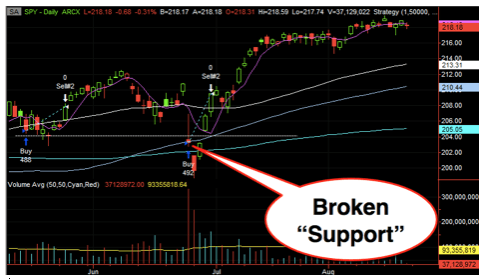
Clear as day…
No sooner had support been broken – then BAM! The S&P shot higher – way higher!
Now I’m not a day trader (I gave that up a long time ago), but you might be.
So here’s a quick trading tip if you want to take it…
Buy the S&P 500 index when it closes at a new 20-day low.
And sell when the index hits a 5-day closing high.
It’s counter-intuitive, right?
It goes against popular wisdom, which is to sell your losers, and ride your winners.
But you can’t argue with the facts.
And if technical analysts had looked deeper into the data, like I did…
They would’ve also discovered…
From 1926 to 1982, whenever the S&P 500 broke support… the right move was for you to absolutely get out of Dodge!
But that stopped being true in 1982 – the year in which index futures were created and sold to investors.
Buying a 20-day low, selling a 5-day high since 1926
Index futures changed everything.
The markets instantly became more volatile, and unpredictable.
Why?
Because index futures provide leverage – massive amounts of leverage.
Leverage that investors, particularly institutional investors, fund managers and the extremely wealthy could use to their overwhelming advantage.
For example, if a number of institutional investors each decide to buy or sell $10 million or $100 million worth of S&P 500 futures contracts…
They fully control tens of billions or hundreds of billions of dollars worth of the S&P 500 index.
Now that’s leverage!
That means they’ve got their hands squarely on the market’s steering wheel!
They could influence its direction up or down!
Which is why the government requires large futures traders to reveal their positions every single week.
And that's so we don’t see a repeat of what the Hunt Brother’s did back in 1980…
When they tried to corner the silver market using silver futures contracts.
Interesting, right?
Well, what I’ve told you so far is just the tip of the iceberg.
Because I didn’t stop digging through the data…
And what I found next…
Will both shock you, and thrill you – and make you thank your lucky stars you got to read this letter…
Because not only will I show you how you could beat the market – time the market to perfection – a stunning 86% of the time…
I’ll also show you…
How you could know every time the stock market’s about to crash with mind-blowing 100% accuracy!
And I’ve got ALL the proof – ALL the data – to back it up.
Where did I find this treasure chest of proof?
I actually found it by accident in of all places… Chicago.
Why was I in Chicago in the first place?
Now that’s an interesting, and somewhat embarrassing story?
My name is Dan Murphy.
And once upon a time (about 20 years ago) I was an investment newsletter junkie.
I’m ashamed to admit it.
But whenever I found a sales letter from an investment editor in my email box…
And he told me I could be rich – generational rich – if I bought whatever stock or system he was pitching…
Even though my BS detector was switched on high…
I fell for it. I subscribed.
Why not? There was always a full money back guarantee if not “100% satisfied.”
Besides, these editors seemed knowledgeable and experienced… their research solid... and the testimonials from their subscribers seemed legit and convincing.
So I subscribed and I faithfully bought the stocks these editors recommended.
And you know what would happen next…
A whole lot of investors would make a whole lot of money when they bought those recommended stocks.
Not me though.
When I finally bought those stocks… I made bupkis!
Okay, sometimes I made a few bucks – but nothing to write home about.
Most of the time I lost money.
Sorta sounds familiar, doesn’t it?
Look, I’m not one to believe in conspiracy theories….
But apparently there was a direct line running from those newsletters to the stock exchanges, and as soon as my buy order had been filled…
There must’ve been an announcement over the exchange’s PA system that said: "Hey everyone, Dan just bought shares of so-and-so. Sell! Sell! Sell!"
But I didn’t quit. I wasn’t going to give up.
Call me pig-headed stubborn if you want.
So what did I do?
I subscribed to other newsletters!
More expensive newsletters!
Newsletters from some of the most highly respected analysts in the business. Names you would definitely recognize.
And lo and behold the stocks these editors recommended actually shot ridiculously higher...
…But not when I owned them!
And I had to know why…
Why was I always on the wrong side of nearly every trade I entered?
So, finally, instead of signing up for more newsletters…
I studied the masters – the Wall Street greats – the guys in the $1,000 suits that decade after decade made millions of dollars every time they bought a stock.
Warren Buffet, George Soros, Carl Ichan, John Boggle, John Templeton, Peter Lynch and a whole bunch of others.
I read the books they wrote. I listened to their interviews.
And I remember, as if it was yesterday, there was this one Wall Street maven, who shall remain nameless…
He was absolutely in love with Nuance, the speech recognition company.
He thought Nuance was the best thing since peanut butter.
He laid out in precise detail why voice-recognition software was the wave of the future.
So of course I researched the company and its market. And what I found matched up perfectly with what this guy was saying.
Therefore, I was also convinced Nuance was going to be a monster winner.
So I bought it! A lot of it!
And as soon as I did… it went straight down the toilet.
But you know what I did next?
I hung onto Nuance.
And then I did what almost every other investor does in that kind of situation...
As soon as the stock got back to breakeven, I sold it.
Ever done that?
If you have…
You know what immediately happens after you sell…
The stock rockets straight to the moon.
So there I was, once again signing the country blues, “I Was In The Right Place, But It Musta Been the Wrong Time…”
In plain English, my timing SUCKED!
My research obviously wasn’t the problem. My research was good. My analyses were good…
But the market just didn’t want to cooperate with me.
Why?
I was doing everything right.
I was picking quality companies – their balance sheets were a thing of beauty. Their earning forecasts were spot on. But I wasn’t making money!
Why?
Well the answer eventually hit me like a bolt of lightening.
What good does it do you to hold the best stocks, the most heavily followed and researched stocks – if the entire market reverses and sells off?
Your stocks are gonna go down with the market, too!
Remember these sell offs?
==> The crash of 1987. It didn’t matter which stocks you were holding - all sectors got hammered. Down went the market, 23%.
==> The dot-com bust of 2000. Again, every sector got hammered. Down went the market, 28%.
==> September 2001, right after 9/11. Try to name a stock that didn’t crater. Down went the market, 26%.
==> The 2008 crash. Once again, it didn’t matter which stocks you owned (even utility stocks fell). Down went the market, 56%.
Of course these were among the most memorable of recent market reversals. The 7.0s on the market’s Richter Scale of crashes.
But there were plenty of smaller market crashes that may have devastated your portfolio over the intervening years as well.
And it didn’t matter one iota how diversified your portfolio was, or how stellar were the stocks that were in it.
When the market tanks, so does your portfolio.
Timing, my friend. It’s all about timing.
If your timing is wrong…
If you’re on the wrong side of the market during a correction, and definitely a crash – all the best research and analyses in the world are as useless as a screen door in a submarine.
A market reversal may not bother someone like Warren Buffett.
When the market goes against him, he just rides it out.
In 2008, his portfolio was down 56%. But he was still a billionaire.
Well, I’m not. And I can’t afford that kind of loss.
Can you?
So I finally got it through my thick head that being right about a stock was nowhere near good enough.
You’ve gotta be absolutely certain you’re trading with the market, not against it.
The market is like an elevator, and all your stocks are just along for the ride.
So if that elevator is headed for the basement – you’re going down with it!
Betting a stock will go up when the whole market is going down is just gonna lose you money.
Unfortunately, it took me years to arrive at that brilliant observation…
And, ironically, I was going up in an elevator at the time.
At that point I had already tried everything to make money in the markets.
I’d been a day trader, a swing trader, a stressed out trader.
But, not surprisingly, it was in the future’s market that I eventually found my pot of gold.
I was making $30,000 a month trading futures contracts.
And I was loving it.
I was living the life of a bachelor California millionaire – expensive toys, expensive women, the whole nine yards…
But all that came to an abrupt end at 2:32 pm EST, Wednesday, May 6, 2010.
A day that will forever be remembered in stock market history as the infamous “Flash Crash.”
In just 36 minutes… the S&P 500, The Dow Jones Industrial, and the NASDAQ Composite collapsed. Completely.
They crashed.
More than $1 trillion – including all my money – disappeared into thin air!
Poof, gone!
The Dow Jones index alone dropped over 1,000 points.
And it all began when a 37-year-old futures trader, Navinder Singh Sarao, fraudulently sold thousands of futures contracts, shorting the S&P 500.
In other words, he had attempted to change the direction of the S&P 500. To make it crater.
That way his short positions would skyrocket in value and make him a quick fortune.
“High Frequency Traders” though immediately noticed what was going on.
High Frequency Traders are trading firms with super-fast fiber-optic cables connecting their computers to the computers on the trading floors at the various stock exchanges.
An overwhelmingly unfair advantage to be sure (but totally legal)…
Because this allows them to see the direction of a single stock, or the overall market, before the average investor can.
Their computers will then automatically place buy or sell orders in parallel to which ever way a stock or the market is moving.
And that’s exactly what happened…
In an instant, the computers at the high frequency trading firms saw Sarao’s bet and bet alongside him – placing massive amounts of sell orders.
When average investors finally saw the result: the market reversing and massively selling off…
They panicked, and sold, too.
And the markets collapsed.
So how do you invest in a world like that?
How do you compete against that – against High Frequency Traders, the fraudsters, and the manipulators?
You can’t!
And that’s exactly what was going through my head the day after the crash as I rode an elevator in the Chicago Board of Trade Building.
A spectacular Art Deco building that towers over Chicago’s LaSalle Street.
It’s where futures contracts on everything from commodities, like corn and steel, to equity indexes, like the S&P 500, are bought and sold.
It’s where millions and billions of dollars are made… and millions and billions of dollars are lost.
In the elevator with me that day were three individuals, presumably futures traders like me.
But these guys were laughing and kibitzing as if the Flash Crash never happened and the world was still their oyster.
Plus, I kept hearing them repeat one word over and over again.
It sounded like an American Indian word… or a personal name…
Siohtee.
Whoever or whatever Siohtee was… he or it apparently had access to information about the future direction of the markets – specifically the S&P 500.
More than that I wasn’t able to hear – and that drove me nuts!
Eventually, we all got off on the same floor. But then they entered a restricted area after flashing their badges to a security guard.
I was dying – I needed to know!
Not who they were – but who or what was Siohtee?
And how the hell could he or it predict the future direction of the S&P 500?
For the rest of the day, my mind was spinning.
I buttonholed everyone I knew who had anything to do with the markets. I asked them if they ever heard of an Indian, a place or a thing called Siohtee...
Everyone shook their head. No one had ever heard of a man, a thing or a place called Siohtee.
But then a stranger standing nearby started to laugh.
“Young man, if you say it slower,” he said, “and separate the syllables, it’s not an Indian word…
“C-O-T stands for Commitment of Traders. It’s a weekly report published by the CFTC, the Commodity Futures Trading Commission, a U.S. government agency.”
I felt like an idiot.
Of course I’d heard of the CFTC, but I had never heard of the COT report.
And neither had any of my trader friends!
I bet none of your friends, relatives, and associates ever heard of it either!
Nonetheless, you’re about to discover how absolutely critical the information buried inside that weekly COT report is to your investment success…
And how much money it could help you earn starting right now…
This is the future revealed…
At fist glance, the COT report is totally indecipherable. Incomprehensible.
It’s page after page, column after column of numbers.
Massive amounts of numbers – enough to cross your eyes – enough to make you want to close the report and never look at it again.
Which, to be honest, was my first instinct.
And yet, I’m a numbers guy! A math nerd.
I love creating spreadsheets and algorithms (yes, for fun I write problem-solving computer programs).
So I knew deep in my gut that the COT report, once I figured it out and harnessed its inherent power…
I could recoup my loses and start making serious money again!
And beyond that…
It could also protect me from opportunistic high frequency traders… from institutional traders… computerized traders. The lords and barons of Wall Street.
All of whom, as a small investor, I couldn’t compete against.
But with the COT report… I finally had an edge…
My U.S. Government supplied winning lottery ticket –
and stay out of jail card!
Ok, so what exactly is the COT report?
Today, sixteen years after discovering it, I could literally write a book or two about it.
In fact that's exactly what I did.
I condensed all that information into a FREE easy-to-read 34-page eBook.
Winning in the Stock Market:
How to Spy on the Secret Trading Moves
of Wall Street’s Moneyed Elite
Just keep reading, and I'll tell you how to download it so you, too, can see a crash coming from a mile away…
Before it destroys your portfolio, your life’s savings and your retirement.
And, on the flip side – you’ll discover how it could also help you see when the markets are about to take off – so you can hitch a ride!
A win-win situation if ever there was one!
Here, let me just give you a quick overview of what you’ll discover in this eBook…
COT: The tail that wags the dog…
In essence, the COT report tells you if futures traders are optimistic or pessimistic about the market.
In other words…
It tells you whether futures traders are buying or selling – and whether the momentum to buy or sell is increasing… slowing… or reversing.
And knowing that, of course, gives you a tremendous advantage…
Because if we’re in a bull market, it could tell you whether your portfolio, your stocks, will continue to make money, or…
If growing numbers of future traders are selling – heading for the exits…
It’s a surefire sign that you’d be wise to do the same.
Of course, the opposite is also true…
If the market’s been in a downtrend… it will tell you whether the smart money is starting to buy again…
And maybe you should, too.
In short, the COT is the closest thing to your personal crystal ball!
It shows you in black and white, week-to-week, what the biggest futures traders, the biggest investors, the biggest financial institutions and corporations are doing.
Are they bullish or bearish?
Are they long S&P 500 futures? Or are they shorting it?
And you want to know the answer!
Because if they’re buying S&P 500 futures contracts, you can bet the S&P 500 will start to go up, too…
If, on the other hand, they’re selling S&P 500 futures contracts…
Then you can bet money we’re headed for a correction… possibly a big correction – possibly a crash – depending on how many are selling, and how fast.
And just in case you think this is all just my take, my opinion, on the predictive power of the COT…
The ISDA, the trade association that represents over 850 financial institutions…
Including investment management companies, insurance companies, and banks – Goldman Sachs and JP Morgan among them…
Attempted to stop the COT from publishing the trading positions of its members.
They even took the CFTC to court!
Because as the ISDA stated, “market participants, including speculators, with such information… would gain a competitive advantage allowing them to trade ahead” of their members.
That’s how powerful, how prescient
and predictive the COT report is!
And how important and critical it is to your investing and trading success.
By the way, the court and the CFTC told the ISDA to go take a hike.
All that trading information remains intact in the COT every single week!
Score a big win for the small investor!
But don’t run out and grab a copy of this week’s COT report, thinking you now have all you need to beat the market.
It would be utter madness to sell all your stocks just because Wall Street’s heavy hitters are shorting the S&P 500 in any given week.
Just as it would crazy to add to your portfolio if Wall Street’s powerhouses are long the S&P 500 in any given week.
Because one week’s COT report tells you nothing – at least nothing you can leverage for gain.
One week is too short a period to see if there’s a sustained and strengthening shift in trader sentiment – up or down.
There are other factors, ratios of buyers to sellers for example, that need to be considered as well.
But I knew if I could crunch the numbers – find a pattern – and validate the pattern through back testing – and create a computer program based on an algorithm that might look something like this:
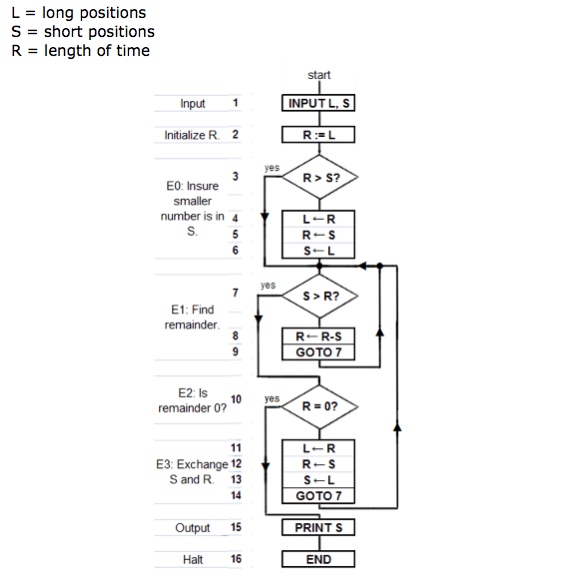
I could then know which way stocks were headed, and when – before they actually made their move.
Of course, it was all theory. A beautiful theory. It just wasn’t all that simple to prove.
I needed more data – far more data than even the COT report provided.
So I purchased a subscription to a professional stock database.
It contained everything I needed to know about every stock of every company – 16,000 companies in all, whether they still exist or not – going all the way back to 1926.
By the way, I still maintain that subscription today. Fifteen years later.
And it’s not cheap.
I pay $20,000 every year to keep it up-to-date. But for me it’s worth every penny.
Next, I collected all the data on every S&P futures contract going back to 1986 – when data on futures contracts first began to be collected.
Needless to say, when I was finished, I had mountains of data to sort through.
So I started writing a program to make sense of it all.
Then, by hand, I meticulously loaded 15 years of my collected data, going back to 1986 – more than 5,400 days worth of data – into the program.
All in an effort to find that pattern – that signal – that could warn me that a market reversal, a change in the direction of the S&P 500 – up or down – was about to occur.
A signal that would give me the edge I had been looking for all my adult life!
The edge that could enable me to compete against the biggest, most powerful, most sophisticated and well-financed institutional traders on Wall Street…
And win!
Understand, crunching all this data and creating a computer program was no late into the night effort at my kitchen table.
It took me five long years of writing one program after another, of back testing the results – of verifying the consistency and accuracy of any pattern that emerged…
And if not completely satisfied with the predictive power of that pattern…
I’d start all over again…
Until finally, I had a real working model – a prototype program I could build upon and fine tune.
But as the months rolled by that program was still not ready for primetime.
There were gaps, holes, flaws in the algorithm, in the sub-routines that I just didn’t know how to fix or plug.
In short, I needed help.
I had gone as far as I could go. I couldn’t do any more on my own.
As a computer programmer, I was now in over my head.
What I had created was definitely good.
But it still wasn’t good enough.
In predicting (via back testing) all past major market reversals, it was only accurate 70% of the time.
So I recruited, actually stole, a programmer from a Fortune 500 company to help me cross the finish line!
To help me prove…
Market timing actually works!
So with my ace programmer now on annual retainer…
We programmed… we tinkered… we tested.
We checked… and rechecked…
And when we thought we were ready…
We did what all scientists do…
We tried to disprove our premise, our theory.
And when we couldn’t…
We took our program out for its final rounds of test drives…
First up: we attempted to predict the infamous October 1987 Stock Market crash known as black Monday.
When the Dow Jones Industrial Average (DJIA) dropped over 22% in one day – the largest one-day decline in DJIA history.
If our program worked…
We’d be able to see a market reversal signal (which I subsequently labeled the Smart Money Indicator, or SMI) just prior to the actual crash.
Holding our collective breaths… I pressed “enter” on the computer keyboard…
Seconds later – BINGO – there it was!
The SMI flashed – indicating the direction of the market was about to reverse.
Next test: December 29, 1997…
If you remember, that was when the IMF announced it was loaning $10 billion to Russia.
At the time, no one, neither economists nor market pundits, knew whether that news would be good or bad for the markets.
Well, sure enough, days before it happened… the SMI indicated it would indeed be good – a moneymaker.
The market would reverse and a new bull market would begin.
And in just 7 months – from December 29, 1997 to June 22, 1998…
SPY – the ETF for the S&P 500 index – rose more than 16%.
Next test... May 26, 2001…
Congress passes President Bush’s new tax relief bill.
Now you’d think the market would view that as great news, right?
But the SMI warned: not so fast!
It flashed that the S&P 500 was going to reverse, and a new bear market would begin.
And sure enough… the SMI was right on the money.
In less than four months, the market dropped 21%
May 26, 2001...
SMI says: SELL SPY
December 17, 2001…
President Bush requests a $48 billion defense budget increase.
Okay, now you would’ve thought defense contractors will take the market higher.
Nope. The SMI said: don’t bet on it!
The S&P 500 dropped 18% over the next 210 days.
Once again, the SMI says: SELL SPY
January 12th, 2008…
The day oil hit $100 a barrel for the very first time.
Would the SMI predict a market rise or a market fall?
If you said fall, you were right.
The SMI confirmed a new bear market was about to begin.
And that bear market lasted well over a year.
Bottom line: we tested every major market reversal, up and down, bull market and bear…
Beginning with the 1987 Black Monday crash… through the post-Y2K crash… the 9/11 crash… the 2008 housing bust… and the 2009 bull market start…
The SMI predicted every major reversal
with 100% Accuracy!
This was amazing. We jumped up and down, hugging each other like two kids who had found the unlocked back door to the world’s biggest candy store.
And then we immediately got back to work…
Then, we tested the SMI for every minor market reversal, bull and bear, rise and decline, from 1986 to the present.
And the SMI predicted 86% of them.
Not perfect, obviously.
But even with 86% accuracy…
The SMI system, without exaggeration, is one of the best investment tools to come along since the invention of the ticker tape machine in 1867.
Because one of its biggest benefits is it allows you to always be invested – to always be in a position to make money.
The SMI system helps to maximize your profits!
And that’s because the SMI system always keeps and eye out for what the market’s about to do next…
Which obviously enables you to position yourself to make money no matter which way the market turns!
The old standard investment strategy of “buy and hold” can’t compete!
Because with “buy and hold” you’re basically closing your eyes and hoping for the best – frozen like a deer in a car’s headlights.
Which is why it’s ridiculed by SMI users as “buy and fold.”
With the SMI, on the other hand, you’re “always in” – always in a position to make a gain – on both the buy and sell side of a trade.
And for novice or conservative investors who want to minimize their risk and are generally opposed to holding individual stocks… it works just as well if not better!
Use the SMI system with Exchange Trade Funds
(ETFs) and be amazed at the results you could see…
ETFs, of course, are proxies for various stock and bond indices.
In that way, they’re very similar to mutual funds, but with two big differences…
They’re easy to trade. You buy and sell them on an exchange exactly like stocks.
And because most are “unmanaged,” the cost of owning an ETF is miniscule compared to mutual funds – which are run by highly paid money managers.
Also, ETFs run the gamut of categories…
They range from ETFs that are stand-ins for the S&P 500 (SPY being the largest and most popular) to ETFs for the 30-year Treasury bond (TLT being the largest and most popular).
Here’s how you could use the SMI system with ETFs
to make a killing in the markets…
Remember, the SMI is the signal that indicates a market reversal, large or small, up or down, is about to take place.
So if the SMI indicates the market, commonly represented by the S&P 500, is turning bullish – about to go up…
What would be the easiest and smartest way to play it, without having to pick and choose individual stocks?
Buy an ETF that tracks the S&P 500.
And I recommend using SPY the oldest and largest S&P 500 ETF out there, and the one with the most liquidity (meaning its easy to trade).
But what if the SMI indicates that the market is reversing – about to decline, or worse, crash?
Well, what do many experienced investors do when they’re getting nervous about the markets or the economy?
They move their money into U.S. Treasuries, typically the 30-year long bond – recognized throughout the world as one of, if not the safest, investment you can own.
And the ETF I recommend for the 30-year long bond is TLT.
So here’s the easiest and simplest way to use the SMI system to make money and stay safe – whether the market is going up, or down…
When the SMI signals that the S&P 500 is about to go up…
You buy SPY.
If the SMI signals that the market is about to reverse, and go down…
You sell SPY (or hold it if you choose), and buy TLT.
Nothing could be easier or simpler. And that way, too, you’re “always in.”
You’re always ready to profit no matter which way the market moves!
The following charts illustrate this perfectly.
In the first chart, had you bought SPY @ $121.31 on May 31, 2011... and held it for two years (buy and hold), until May 31, 2013, at which time you sold it @ $153.86...
You could’ve realized a gain of 26%. Pretty good, right? Nothing to complain about.
SPY – When Buying and Holding…
But now…
Look at what you could’ve made using the SMI system… moving from SPY to TLT and back again each time the SMI flashed…
First, you would’ve bought SPY @ $121.31 on May 31, 2011, as in the buy and hold scenario…
But you would’ve sold SPY on July 5, 2011 @ $121.25 – when the SMI flashed that the market was about to reverse...
And you would’ve bought TLT @ $82.46…
And you would continue to switch back and forth between SPY and TLT every time the SMI flashed until May 31, 2013, two years later. Just as in the buy and hold scenario...
But now the end result… is far better!
Your cumulative gains would’ve been 72% – nearly doubling your money and earning you almost three times more than the buy and hold strategy!
Who said you can’t perfectly time the market?
I could give you plenty more examples showing you, you can!
There’s no denying it… without the SMI system protecting you, guiding you – you’re at the complete mercy of the markets.
Worse, you’re investing blindfolded.
The SMI system gives you eyes that help you see into the future.
Information that’s vital to your investing success!
Because it warns you when the market is about to go up and when it could go down…
Right now the SMI is 86% accurate for all minor to moderate market reversals (and 100% accurate when predicting a crash) – which, when you think about it, is crazy amazing!
When have you ever heard of a trading tool that’s 86% accurate?
Yet every day my team and I are fine-tuning it to get it even more accurate. We are determined to have it achieve a 95% accuracy rate!
But even with an 86% accuracy rate....
There’s no single indicator out there that’s more accurate.
And aside from helping you make more money – the SMI system could help prevent you from losing money!
And who wants to lose money?
It’s Warren Buffett’s rule #1 as an investor.
Don’t lose money!
And that’s exactly what the SMI system could help you do.
Make more money not lose money!
So how can you, today, access the SMI system?
Well, it’s really as simple as saying: Yes, please send me alerts every time the SMI flashes.
And just like that I’ll send you an email every time the SMI flashes – alerting you that there’s as high as an 86% probability of the market changing direction.
Of course if the market is about to crash – and I mean really crash…
As I already showed you – you’re virtually bullet proof… because the SMI has never, ever been wrong!
It’s been 100% accurate every time a crash was just around the corner.
So tell me, where else can you find an investment tool like the SMI – that’s so accurate and yet so simple and easy to use?
Just read my email alerting you to a market reversal. And that’s it!
You don’t have to do any calculations.
I don’t bore you with monthly after-the-fact market commentary – which you’re probably reading somewhere else anyway.
I don’t bore you with “best guess analyses” on this or that stock.
Because the SMI system is not a stock picking service.
It doesn’t recommend stocks to buy or sell.
Instead, whenever the SMI determines that the S&P 500 is about to change course – to reverse direction – up or down…
You’ll get an email from me telling you exactly that.
If the SMI flashes that the market’s about to go up…
You’ll be alerted that now could be the best time to increase your position in ETFs or stocks you already own…
Or establish a position in those ETFs or stocks you’ve been waiting to buy.
If the SMI flashes the market is about to go down…
Just hedge your portfolio by purchasing TLT, the ETF for the 30-year U.S. Treasury bond.
What can be easier…?
Just like you rely on the weather report to tell you if it’s going to be hot or cold, rainy or sunny…
The Smart Money Indicator is your weather report for the stock market.
But unlike a weather report – it’s been 86% accurate – and has been for the past 30 years!
In other words, The Smart Money Indicator gives you the awesome power to make the right investment decisions at the right time.
In short, the SMI gives you the awesome power to make the right investment decisions at the right time.
And at the same time it helps you avoid painful double-digit losses! Just like I already showed you.
Which begs the question: why in the world would anyone invest without using my SMI system?
It wouldn’t make sense not to!
Especially when you can start using the SMI system today – and continue using it for the next 12 months…
For just $99!
That’s right! You can have access to the SMI system for a full year for just $99.
And of course the SMI system comes with a rock-solid, all your money back guarantee.
If you’re not 100% satisfied with the SMI system – for any reason – any reason whatsoever – I will refund to you every penny of your $99.
No questions asked.
And you don’t have to give me a reason why you’re choosing to cancel, if you do.
Plus, you have an entire 60-days to ask for your money back.
If you’re just not satisfied with the SMI system for any other reason…
Just ask, and I’ll return your $99. Every penny of it.
Plus, with your subscription today you’ll also receive a complimentary copy of my eBook:
Winning in the Stock Market:
How to Spy on the Secret Trading Moves
of Wall Street’s Moneyed Elite
But whatever you decide… to subscribe or not…
DO NOT get caught with your pants down – blindsided by the next guaranteed-to-come market reversal!
And though the SMI isn’t flashing yet – I have to tell you…
It’s near a trigger point – just a notch below what a full flashing alert requires.
So we’re close. Very close to either a correction or a full on crash.
Last week’s COT report shows the smart money definitely moving to the sell side…
That money just hasn’t been moving to the sell side long enough and with enough intensity to prompt a full-fledged SMI alert.
It’s like the difference between a hurricane watch and a hurricane warning.
The former tells you to pay attention. The latter says start boarding up the windows.
Right now we’re at the hurricane watch stage – PAY ATTENTION!
But if and when we get to the hurricane warning stage – which could come with next week’s COT report…
With the SMI system protecting you, watching over you – you’ll be among the first to know.
So please, don’t be like the hundreds of thousands of investors who rely on Yahoo Finance, Bloomberg, MarketWatch, and high-priced investment newsletters to keep them informed and protected.
Those publications can only tell you what’s happened after it’s already happened…
After the hurricane swamps your portfolio!
After-the-fact analyses and opinions have little to no value.
They offer no help, no insight when they’re needed the most.
Which is before the market reverses – before it crashes, or before it skyrockets higher!
And yet that’s exactly what the SMI system does – it alerts you before the market reverses, up or down.
The SMI system is based on facts, on government-supplied data…
The required buy and sell disclosures made by the biggest, most powerful traders in the futures markets…
And the tested and back-tested algorithms my team and I have put in place.
Also, just so you know…
Historically, large market reversals happen up to five times a year.
Which means you’ll have five solid chances to make money every time the market changes direction over the next 12 months.
The weekly minor reversals aren’t as impactful or critical to your investments so I typically won’t drive you crazy sending you alerts for those.
But when the bigger ones are ready to hit – if you’re using the SMI system… you’ll be forewarned.
And realize this too…
As almost every serious market watcher knows…
The worst performing year (since 1900) for the stock market…
Is the first year of a new Presidency.
So, with Donald Trump sitting in the White House…
2017 is all but guaranteed to be one helluva ride for the markets – up and down!
It could be a Six Flags rollercoaster of a year!
But that just means you could have even more opportunities to make serious money with ETFs or stocks…
If you’re using the SMI system.
Because only the SMI system can give you the confidence to safely trade in any market – bull or bear.
Where can you buy that kind of piece of mind… that kind of protection – that kind of market intelligence – for just $99?
Subscribe to the SMI system right now by clicking the subscribe button below…
And not only will you receive the SMI system for the next 12 months…
Plus, a copy of my eBook…
Winning in the Stock Market:
How to Spy on the Secret Trading Moves
of Wall Street’s Moneyed Elite
You’ll also receive this…
A SMI Money Saving Bonus!
When you subscribe right now – I’ll also give you an extra 12 months of the SMI system absolutely FREE!
That’s right, pay just $99 right now and you’ll be subscribed to the SMI system for the next 2 years!
That comes out to less than 14 cents a day!
14 cents a day to help protect you from catastrophic market reversals that could cost you thousands of dollars in loses.
While at the same time providing you with plenty of chances to capture thousands of dollars in gains!
And you’ll still have up to 60-days to cancel your subscription and receive back every penny of your $99.
In return all I ask is that you do me one small favor if you can…
If you’re satisfied with the SMI system… and my eBook has opened your eyes to how the stock market really works – and how you could make it work for you…
Tell your friends about the SMI system… and send them an email with my eBook attached to it so they can read it as well.
Or simply forward this letter to them. That’s easy enough!
Believe me you’ll be doing them a big favor. And you’ll feel good for having done it – helping them to make money.
After all, who doesn’t want more money?
So what are you waiting for…?
Subscribe right now – before the market crashes and takes your money down with it.
Thank you for your time, and for allowing me to introduce you to the SMI system.
Sincerely,

Dan Murphy
Founder of The Smart Money Indicator
To become a Smart Money Indicator subscriber please click the subscribe now button below: