Dear Reader,
In this presentation you will first receive the means – the power – to protect your money…
Protect your investments.
To shield yourself from future financial devastation…
From Wall Street’s cheating and manipulating – yes, cheating and manipulating – too-big-to-fail power brokers and market shakers.
From the High Frequency Traders (HFTs)…
Large firms with banks of computers and megaflops of computing power – enough technological muscle and financial strength to crash markets, suspend trading…
And earn themselves millions of dollars while you eat the losses.
Today, you’ll be free of this reckless, overwhelming brute financial force…
From the hedge funds and mutual funds that can move tens of millions of dollars out of one company – which you may own and into another you don’t – in the blink of an eye…
From the billionaire raiders and activists who can crush company after company like bread sticks… just to line their pockets with your money.
You’ll be free of this financial fear and intimidation.
By the time this short presentation ends you will possess “powerful insider intelligence.”
The chance to know, to see exactly what Wall Street’s dominators, the heavy hitters, are up to.
Before they cause stocks to suddenly reverse direction…
To fall…
Or, to rise…
And when you know this…
Which way the Titans of Wall Street are leaning, what they are planning…
If you have advance knowledge – actionable insider intelligence – about which way the markets are about to move… up or down…
I guarantee you this…
You will have the power, and the confidence to know when to sell a stock… when to hold it… and when to buy a lot more of it.
You will have foreknowledge of all those wonderful rallies you couldn’t see coming, and those devastating crashes that blindsided you.
You won’t be a victim anymore!
Not when you have advance warning – advance knowledge.
The kind of knowledge the average investor can only read about and react to after it happens.
When it’s already too late!
If you could know what’s about to happen in the markets before it happens…
You could finally be the master of your financial ship – free to chart your own course, to seek your own fortune.
And as impressive as this all sounds...
I know you think it’s too good to be true – impossible to believe.
Immediately below you will see chart after chart, proof after proof that you could buy any stock – large-cap, mid-cap or small-cap…
In any sector, in any industry – be it a utility company or a biotech…
A blue chip or a speculative start-up, and…
Double, triple, even quadruple your gains!
Without options.
Without a margin account.
Without leverage of any kind.
In other words, with almost zero risk of a loss!
Instead… you’ll do it just by buying and selling any stock you choose the old fashioned way. With a simple buy and sell order.
And to show you this isn’t just talk….
I’m going to put $1,040,000 of my own money where my mouth is.
I’m going to shell out $1,040,000 of my own money – just to prove to you:
1. It’s extremely easy to do. So easy that a child, a junior high school student – with no investing experience – no insight whatsoever into the world of finance, business or economics…
He or she can buy any stock – without even knowing anything about the underlying company – what it does, how it’s been performing – and potentially double or triple his or her investment return.
2. It’s an absolute must for every investor who wants to make money and not lose money. Because in this crazy, volatile market, where from one day to the next you don’t know if the stock market is going to crash or soar…
This strategy will help protect you.
And it doesn’t matter whether the next U.S. President is a Democrat or a Republican.
3. And it works equally well in bull and bear markets. Whether stocks are going up or down, whether oil rises or falls, whether the economy grows or contracts, whether there’s war or peace, terrorism or calm…
It simply doesn’t matter!
You could make more money using this investment strategy I’m now about to lay out for you than by following any other investment strategy, system, or decision-making process you’re currently using or considering using.
And without a doubt, you could make a lot more money than if you’re merely buying and holding, and hoping for the best.
For example, look at the chart below of AIG, the big insurance company.
As you can see, had you bought shares of AIG on April 4, 2009 @ $14.12 and sold your shares one year later on April 3, 2010 @ $26.15…
You could’ve realized a gain of 85.19%.
Not bad, right? Nothing wrong with an 85% gain.
However, had you bought AIG in 2009, on that same day and price as above, and sold it one year later, on that same day in 2010, and at the same price, $26.15 – using my strategy…
You could’ve realized a gain of 226.26%.
Almost triple the gain of the traditional buy and hold strategy!
Crazy, right? Yet it’s so easy to do!
And remember, I’m not using options or leverage of any kind.
Ever hear the joke about how to make $1 million investing in airline stocks?
The answer: you invest $10 million, and in no time at all you’ll only have $1 million left.
But not when you use my strategy!
Using my strategy, that $10 million could’ve become $20 million!
Look at Boeing – the undisputed 600-pound gorilla among airline companies.
According to the chart below…
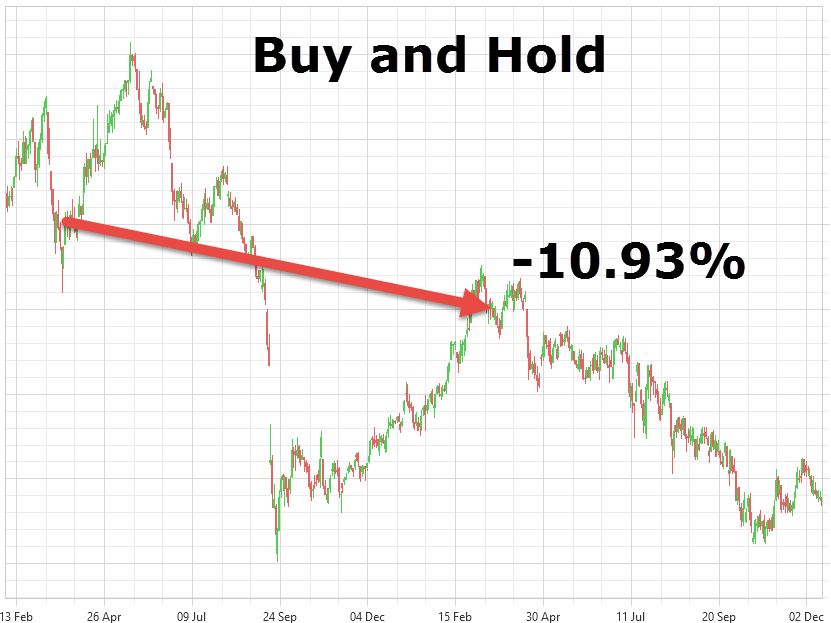
Had you bought shares of Boeing on March 24, 2001 @ $53.55 and sold your shares one year later, on March 16, 2002 @ $48.27…
You would’ve lost money. You’d be down 10.93%
Not a terrible loss as things go – but a loss, nonetheless.
And who likes to lose money, even a little? I don’t. Do you?
That’s why if you had used my strategy…
Buying the exact same shares of Boeing… on the same date and at the same price as above… and then selling them one year later at the same close out price…
You could have captured a gain of 108.16%. More than doubling your money!
Ok, one more example… before I explain my strategy to you and show you how to use it…
Do you stream TV shows and movies on your computer, mobile devices, and of course on your TV?
Then you’re either a subscriber to, or at least heard of, Netflix.
And maybe a few years back, you saw the writing on the wall: Netflix was going to be huge.
So on September 18, 2010 you bought 1,000 shares of Neflix @ $20.29.
But two years later, by 2012, you’d had enough of the stock’s crazy ups and downs. So you sold your shares on March 31, 2012 @ $16.40.
And you swallowed the loss – and it was a fairly big loss, too.
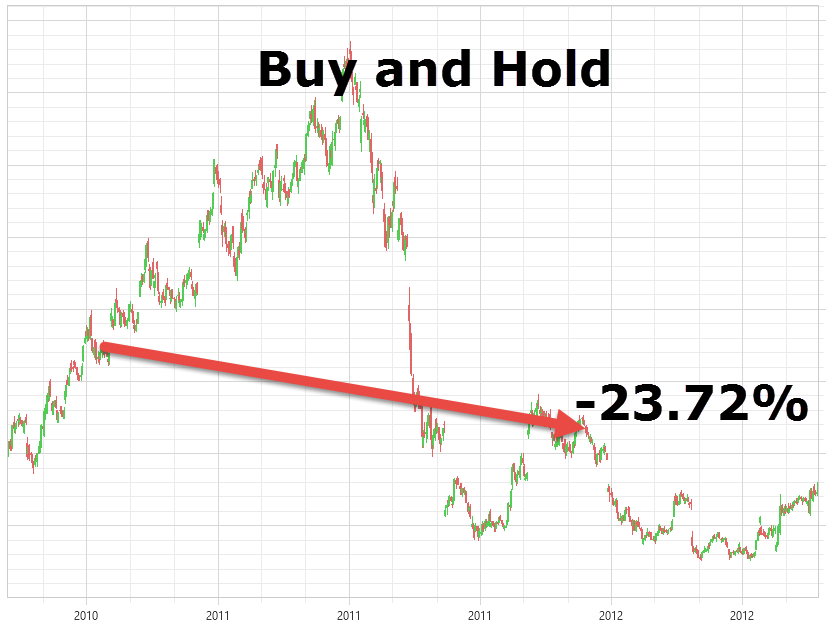
Down 23.72% – you lost $3,890 on the trade.
Ouch!
But you would’ve suffered no loss at all had you used my strategy.
In fact, had you bought 1,000 Netflix shares – at that same price on that same day in 2010 – and sold your shares at that same price on that same day in 2012…
You could’ve bagged a stunning 192.92% gain!
And walked away with $39,143 in your pocket (minus a small commission charge, if you used a discount broker).
And again, you could’ve achieved that gorgeous gain without options or leverage of any kind!
How’s that possible?
My name is Dan Murphy.
And once upon a time I was an investor just like you.
I even subscribed to a whole bunch of investment newsletters, just like you probably do right now.
And probably for the same reason:
All these newsletter editors seemed knowledgeable and experienced… their research seemed solid... and the testimonials from their subscribers seemed legit and enticing.
So like you, I subscribed. And I faithfully bought the stocks these editors recommended.
And I’m sure a whole bunch of investors made tons of money when they bought those recommended stocks.
But not me.
Not when I bought them.
I made bupkis. I lost money.
Apparently, there was a direct line running from those newsletters to the exchanges, and as soon as my buy order had been filled…
Over the PA system there must’ve been an announcement: "hey everyone, Dan just bought shares of so-and-so. Time to crush the stock!"
Look, I’m not one to believe in conspiracy theories.
But I sure as hell felt as if I was being played for a sucker.
You ever feel like that?
Nevertheless, I wasn’t about to give up.
Call me pig-headed stubborn if you want.
So I subscribed to even more newsletters.
Expensive newsletters!
Newsletters from some of the most highly respected analysts in the business. Names you would definitely recognize.
And I read their newsletters religiously.
Of course, the stocks these editors recommended eventually made obscene amounts of money...
Just not when I owned them!
Yes, I could’ve quit investing at that point.
But I couldn’t get this one thought out of my head…
Even though I was consistently on the wrong side of nearly every trade I entered…
I knew there were scores of other investors who were actually making money!
And some were making ridiculously huge amounts of money!
And I wanted to know who they were and how they did it.
So instead of signing up for more newsletters, I researched the heavy weights, the Wall Street gurus – the guys that decade after decade were actually pulling in the big bucks.
Warren Buffet, George Soros, Carl Ichan, John Boggle, John Templeton, Peter Lynch and a bunch of others
I read the books they wrote, what they said in interviews.
And I remember one Wall Street maven. He was in love with Nuance, the speech recognition company.
He explained how the whole world was changing and that voice-recognition software was the wave of the future.
So I researched the company, and everything this guy had said mirrored exactly what I had found on my own.
Therefore, I was absolutely convinced Nuance was going to be a monster winner.
So I bought it!
And naturally it went straight down the toilet...
But you know what I did?
I hung onto Nuance. And then I did what almost every other small investor does in that kind of situation...
As soon as I got back to breakeven, I sold it.
Ever done that before?
And you know what happens after you do that, after you sell your bad boy stock?
That stock rockets straight to the moon.
So there I was, once again signing the Country Blues, “I Was In The Right Place, But It Musta Been the Wrong Time…”
Yup, as usual, my timing sucked!
No matter how good my research… no matter how astute my analysis… no matter how profound my insights – it seemed like the market just didn’t want to cooperate with me.
I was doing everything right in terms of picking quality companies – good stocks – but I wasn’t making money.
So what good is holding the most thoroughly researched stock when the over all market sputters and falls?
Because it doesn't matter what the earnings forecast is for this or that stock.
They’re all gonna go down!
If your timing is wrong… if you’re on the wrong side of the market… all the research in the world is as useless as a screen door on a submarine.
When the entire market goes down, your stocks are going down with it.
Now that may not bother Warren Buffett.
When the market goes against him, he just rides it out.
In 2008, his portfolio was down 56%.
But I can’t afford that kind of loss.
Can you?
So I finally got it through my thick head that being right about a stock was not nearly good enough.
My timing had to be rock solid as well.
Look at the facts – and learn from market history!
• During the crash of 1987, it didn’t matter which stocks you were holding - all sectors got hammered. Down went the market, 23%.
• During the dot-com bust of 2000, again, every sector got hammered. Down went the market, 28%.
• In September 2001, after 9/11, try to name a stock that didn’t crater. Down went the market, 26%.
• In the 2008 crash, once again it didn’t matter what stocks you owned. Even utility stocks went south. Down went the market, 56%.
Of course these were among the most memorable of recent market reversals. The 7.0s on the Richter Scale.
But there were plenty of smaller market earthquakes that may have devastated your portfolio over the intervening years.
And it didn’t matter one iota how diversified your portfolio was, or how stellar were the stocks in it.
When the market tanks, so does your portfolio.
But if expert stock picking and a diversified portfolio will not keep you safe, what will?
Being on the right side of the market, of course.
You have to be certain you’re trading with the market, not against it.
Betting on a stock to go up while the whole market is going down is obviously a losing proposition.
The market is like an elevator and the individual stocks are just along for the ride.
It doesn’t matter how strong or weak are the stocks inside the elevator – they’re all destined to go in the same general direction as the elevator.
Otherwise, it’s like trying to get to the penthouse in an elevator that’s going to the basement.
It’s almost impossible to make money that way!
Therefore, you want to make sure the stocks you’re betting on will go in the same direction as the market.
But how do you that?
For me the answer actually started to crystalize years later, while, strangely enough, I was going up in an elevator.
By then I had tried everything to make money in the markets.
I’d been a day trader, a swing trader, a stressed out trader.
But it was in the future’s market that I eventually found my pot of gold.
I was making $30,000 a month trading futures contracts.
And I was loving it.
I was living the life of a bachelor California millionaire – expensive toys, expensive women, the whole nine yards…
But that all came to an abrupt end at 2:32 pm EST, Wednesday, May 6, 2010.
A day that will forever be remembered in stock market history as the infamous “Flash Crash.”
In just 36 minutes… the S&P 500, The Dow Jones Industrial, and the NASDAQ Composite collapsed...
And more than $1 trillion disappeared into thin air – taking my money, of course, with it.
The Dow Jones index alone dropped over 1,000 points.
And it all began when a 37-year-old futures trader, Navinder Singh Sarao, fraudulently sold thousands of futures contracts – shorting the S&P 500.
Basically, betting that the S&P 500 would fall.
His gambit was immediately noticed by High Frequency Traders – trading firms with super-fast fiber-optic cables that connected their computers to the computers on the trading floors of the various stock exchanges.
An overwhelmingly unfair advantage to be sure.
Allowing them to see the direction of a single stock or the overall market before the average investor can – and automatically placing a computer-generated buy or sell order.
And that’s exactly what they did.
They saw Sarao’s bet and bet alongside him – instantly placing massive amounts of sell orders.
When average investors finally saw the result, they panicked.
And the markets collapsed.
So how do you invest in a world like that? How do you compete against that – against High Frequency Traders, the fraudsters, and the manipulators?
You can’t.
And that’s exactly what was going through my head as I rode in an elevator in what had once been my home away from home… but was now the heart of darkness.
The Chicago Board of Trade Building.
A spectacular Art Deco building that towers over Chicago’s LaSalle Street.
This is where futures contracts on everything from commodities to equity indexes, like the S&P 500, are bought and sold...
Where millions and billions of dollars are made, and millions and billions of dollars are lost.
In the elevator with me were three individuals, presumably futures traders.
They were laughing and kibitzing as if the Flash Crash never happened and the world was still their oyster.
I didn’t know them personally.
But that didn’t stop me from eavesdropping on their conversation.
And I kept hearing them repeat one word over and over again.
It sounded like an American Indian word… or personal name. Siohtee.
Yet, in the context of their conversation it seemed to possess extreme significance or insight into future market direction, specifically the S&P 500.
Eventually, we all got off on the same floor. But then they entered a restricted area after flashing their badges to a security guard.
I was dying with curiosity!
Not about who they were, but about Siohtee!
What was it – who was it?
And how the hell could he or it predict the future direction of the S&P 500?
For the rest of the day, my mind was spinning.
I buttonholed everyone I knew who had anything to do with the markets. And I asked them if they ever heard of an Indian, a place or a thing named Siohtee...
Everyone just shook their head. No one ever heard of a man, a thing or a place called Siohtee.
But then, someone, a stranger, who had been eavesdropping on me, started to laugh.
“Young man, if you say it slower,” he interrupted, “and separate the syllables, it’s not an Indian word…
“C-O-T. It stands for Commitment of Traders.
“It’s a weekly report published online by the CFTC… which stands for,” he added, now clearly having fun with me, “the Commodity Futures Trading Commission, a U.S. government agency.”
I felt like an idiot.
Nevertheless, I thanked that stranger profusely.
I knew what the CFTC was, of course – but to my embarrassment, I had never heard of the COT report.
And neither had any of my trader friends!
And I’ll bet none of your friends, relatives, and associates know what it is either!
Or how absolutely critical the information buried inside that weekly report is to your investment success.
But you will.
You’re about to discover what exactly the COT report is – how powerful it is – and how much money it could help you earn starting TODAY!
How the future is revealed.
Now the COT report at first glance is completely indecipherable.
It’s page after page of numbers.
Massive amounts of numbers – enough to cross your eyes – enough to make you want to close the report and never look at it again.
Which was my first instinct.
And yet, I’m a numbers guy! A math nerd.
I love creating spreadsheets and algorithms (yes, for fun I write problem-solving computer programs).
And I knew deep in my gut that the COT report, once I figured it out and harnessed its inherent power…
It could make me rich again!
It could protect me from opportunistic high frequency traders… from institutional traders… computerized traders… from the manipulators and the fraudsters – the Lords and Barons of Wall Street.
All of whom, as a small investor, I couldn’t compete against.
I was completely at their mercy.
But with the COT report… I might finally have an edge – and even be one step ahead of them.
It's the U.S. Government supplied winning lottery ticket!
Ok, so what exactly is the COT report?
Today, ten years after discovering it, I could literally write a book or two about it (which actually might not be a bad idea all things considered).
But for brevity’s sake, let me give you the view from 30,000 feet up.
It's the tail that wags the dog!
In a nutshell, the COT report tells you who’s buying and selling futures contracts, and how many buyers and sellers there are.
In other words, when viewed correctly it’s an indicator of investor sentiment and confidence – about the future.
The future of corn prices, the future of pork belly prices – and for our purposes, the future of the S&P 500.
The stock market.
The COT report shows you in black and white, week-to-week, what the biggest traders, the biggest investors, the biggest financial institutions and corporations are doing.
Are they long S&P 500 futures? Or are they shorting it?
In other words, are they buying S&P 500 futures contracts, because they believe the index will go up…
Or are they selling S&P 500 futures contracts, because they believe the S&P 500 will go down.
Of course it tells you a lot more than that, but that’s the basic gist of it.
And get this…
The ISDA, a trade association that represents over 850 financial institutions…
Including investment managers, insurance companies, and banks (Goldman Sachs and JP Morgan among others)…
Attempted to suppress the information in the COT report, because as they see it:
“Market participants, including speculators, with such information on non-traditional commercial trends, would gain a competitive advantage allowing them to trade ahead…” of their members.
That’s how powerful the COT report is – and how important and critical it is to your investing and trading success.
By the way, the CFTC told the ISDA to take a hike.
So all that information stays in the COT report.
Score a big win for the small investor!
But here’s the problem…
Given that a rising ocean lifts all boats, just as a falling ocean sinks all boats – metaphorically speaking…
It would be madness to sell all your investments just because most of Wall Street’s heavy hitters are shorting the S&P 500 in any given week…
Or, for that matter, add to your portfolio, when, in any given week, most of Wall Street’s heavy hitters are long the S&P 500.
Because one week’s COT report tells you nothing – at least nothing you can leverage for a gain.
One week to the next is too short of a period. There’s no discernable pattern that can be extrapolated.
Then, too, you’d have to know what ratio of buyers to sellers is statistically significant, and over what period of time.
There are other factors that need to be considered, too.
But I knew if I could crunch the numbers – and find a pattern – and validate the pattern through back testing – and then create a program, an algorithm that might look something like this:
L = long positions
S = short positions
R = length of time
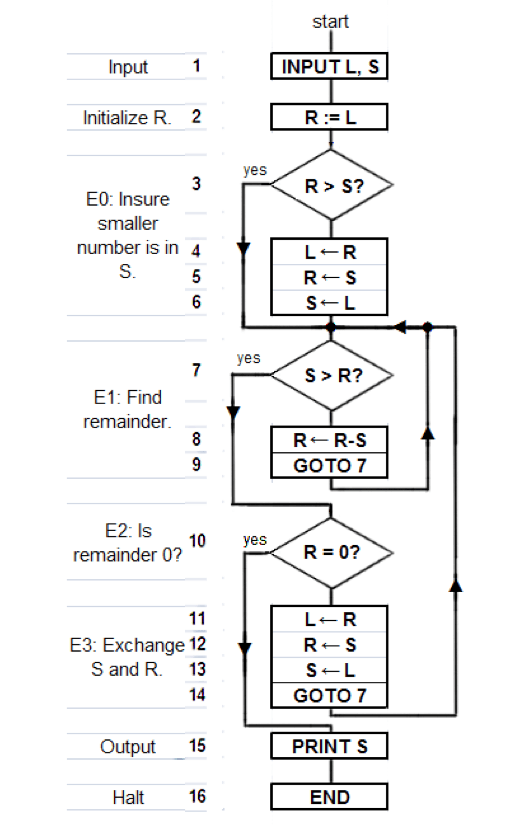
I could then know which way stock prices were headed – and when – before they actually made their move.
Of course, it was all theory. A beautiful theory. Unfortunately, it wasn’t all that simple to execute, much less prove.
I needed more data – far more data than even the COT report provided.
So I bought a subscription to a professional stock database.
It contained everything I needed to know about every stock of every company – 16,000 companies in all, whether they still exist or not – going all the way back to 1926.
By the way, I still maintain that subscription today.
And it’s not cheap.
I pay $20,000 every year to keep it up-to-date. But for me it’s worth every penny.
Next, I collected all the data on every S&P futures contract going back to 1986 – when data on futures contracts first began to be collected.
Needless to say, when I was finished, I had mountains of data to sort through.
So I started writing a program to make sense of it all.
Then, by hand, I meticulously loaded 15 years of my collected data, going back to 1986 – more than 5,400 days worth of data – into the program.
All in an effort to find that pattern – that signal – that going forward could positively indicate a forthcoming change in the direction of the S&P 500.
In short, alerting me that a market reversal – up or down – was about to occur.
Thereby, giving me that edge I so desperately wanted – and needed!
To compete against the biggest, most powerful, most sophisticated and well-financed institutional traders on Wall Street…
And win!
To eat their lunch!
Now understand, this was no late into the night at the kitchen table endeavor.
It took me five long years of writing one program after another, of back testing the results – of verifying the consistency and accuracy of any pattern and signal…
And then, when not satisfied… starting all over again…
Until finally, I had a real working model – a prototype program I could fine tune.
But as the months rolled by, my program was still not ready for primetime.
There were gaps, holes, flaws in the algorithm, in the sub-routines that I just didn’t know how to fix or plug.
In short, I needed help.
I had gone as far as I could go. I couldn’t do any more on my own.
As a computer programmer, I was now in over my head.
What I had created was definitely good.
But it still wasn’t good enough.
In predicting (via back testing) all past major market reversals, it was only accurate 70% of the time.
So I recruited (actually stole) a programmer from a Fortune 500 company to carry me the final 30 yards – to take my dream, my program into the end zone!
To score us a touchdown and a Super Bowl win!
To not only predict all past moves of the S&P 500 – but all its future moves as well!
To prove that, yes, market timing can actually work!
And that ultimately, it may be the only way to level the Wall Street playing field.
And even tilt that playing field in my favor!
So instead of getting screwed over nearly all the time by the big and powerful, well-connected institutional traders…
I'd have home field advantage!
Okay, so with my ace-in-the-hole programmer now on annual retainer…
We programmed… we tinkered… we tested.
We checked… and rechecked…
And when we thought we were ready…
We did what scientists do…
We tried to disprove our premise, our theory…
And when we couldn’t…
We took our program out for its final rounds of test drives…
First up: to predict the infamous October 1987 Stock Market crash – known as black Monday.
When the Dow Jones Industrial Average (DJIA) dropped over 22% in one day – the largest one-day decline in DJIA history.
If our program worked…
We would see a “market reversal signal” (which I subsequently labeled the Z-point) just prior to the actual crash.
We pressed enter on our computer keyboard…
And BINGO – there it was!
The Z-point flashed – indicating the direction of the market was about to reverse.
Next up: December 29, 1997.
The IMF announced it was loaning $10 billion to Russia.
At the time, no one, neither economists nor market pundits, knew whether that news would be good for the markets or not.
Well, days before it happened… the Z-point indicated the market would reverse, and begin a new bull run.
And sure enough, in less than one year, from December 29, 1997 to June 22, 1998, the S&P 500 rose more than 16%.
Z-Point Buy December 29, 1997
Next test…
May 26, 2001: Congress passes President Bush’s new tax relief bill.
You’d think the market would’ve viewed that as great news.
But the Z-point warned: not so fast!
It indicated that the market, the S&P 500, would reverse, and a new bear market would begin.
It was spot on.
In less than four months, the market dropped 21%
Z-Point Sell May 26, 2001
December 17, 2001:
President Bush requests a $48 billion defense budget increase.
You would’ve thought defense contractors would lead the market higher.
The Z-point said otherwise.
The S&P 500 dropped 18.1% over the next 209 days.
Z-Point Sell December 17, 2001
January 12th, 2008:
The day oil hit $100 a barrel for the very first time.
Would the Z-point predict a market rise or a market fall?
If you said fall, you were right.
The Z-point confirmed a new bear market was about to begin.
And that bear market lasted for well over a year.
Bottom line: we tested every major market reversal, up or down, bull market or bear…
Beginning with the 1987 Black Monday crash… through the post-Y2K crash… the 9/11 crash… the 2008 housing bust… and the 2009 bull market start…
The Z-point predicted EVERY SINGLE ONE!
Then, we tested for every minor market reversal, bull and bear, rise and decline, from 1986 to the present.
And the Z-point predicted 86% of them.
In fact, in the 13 years since 2003, it was wrong only twice.
Not perfect, obviously. But we’re continuing to tweak the “Z-point system.”
And we’ll continue to tweak it until we get a 95% or above accuracy rate.
In the meantime…
We took the Z-point system out into the real world… to see if the average investor can use it right now to start making money.
Here’s what we did…
We compared the predictive strength of the Z-point system to the stock-picking prowess of a very well known analyst…
Who happens to have a very popular cable network TV show.
I won’t name him outright.
Because I’ll immediately get slapped with a cease and desist order…
Consequently, this presentation will be removed from the Internet…
And I’ll have to hire lawyers to prove I’m not defaming him when he takes me to court.
Yet, all I’m trying to do is prove a very simple point:
Which is…
The Z-point system is the best chance you have to protect your investment portfolio…
To stay one step ahead of the makers and shakers that rule Wall Street – and who take home most of the money.
So… I’ll simply refer to this gentleman as… Mr. TV.
But if you can figure out who he is… more power to you.
Now, Mr. TV does not maintain a website displaying the gains or losses of his stock picks.
Fortunately, the Motley Fool does.
In fact, they keep track of his stock picks going back years.
So I spun the dial, so to speak, and picked a date, June 24, 2006, to see which stocks Mr. TV was “holding” at the time.
According to the Motley Fool, he had nine BUY recommendations within two weeks of that date.
I couldn’t find history on two of his stock picks (probably because they’re no longer traded) – but I found history on the other seven.
In the graph below are those seven stocks, and how they performed over a three-year period (2006 thru 2009):
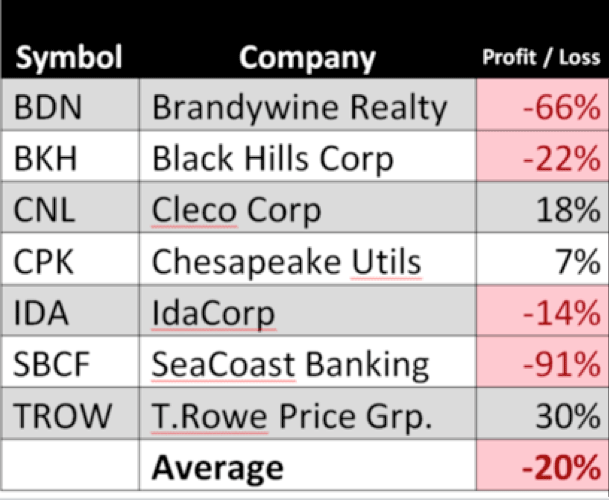
Three-year period (2006 thru 2009)
As you can see, Mr. TV had three winners during that time.
His big winner, T. Rowe Price, rose 30%.
However, his combined average return was not good.
Had you bought and held these same seven stocks over that same period of time… you would’ve lost 20% of your money.
(Actually, when I think about my experience following buy recommendations from other stock gurus and investment newsletters, a 20% loss seems pretty average. What about you?)
So how did those same seven stocks perform – had you used the Z-point system?
In four words… a helluva lot better!
Just look at the chart below:
Same Three-year period (2006 thru 2009)
If you had used the Z-point system…
You could’ve made money with six of these seven stocks.
Scoring an average gain of 55% using the Z-point system – instead of an average loss of 20% without the Z-point system.
Granted, it wasn’t perfect. Yet, the one loss recorded (SeaCoast Banking) was nearly half the loss suffered by Mr. TV’s pick (-91% vs. -49%).
How is that possible?
The Z-point system is an “always-in” strategy. Not a buy and hold strategy. And that difference is critical.
It enables you to make money no matter which way the market turns.
Now the safest way to use the Z-point system, that is to say for investors who are conservative, who want to minimize their risk, and are generally opposed to holding individual stocks…
I recommend using ETFs.
ETFs, of course, are proxies for various indices, in that they hold a basket of stocks, or bonds.
In that way they’re similar to mutual funds, but with two big differences.
They trade exactly like stocks. In other words, you buy and sell them on an exchange – just like stocks.
And because most are “unmanaged” the cost of owning an ETF is miniscule compared to mutual funds, which are run by highly compensated money managers.
ETFs run the gamut of categories.
So there are, for example, ETFs for the S&P 500, the DJIA, the various biotech indices, the 30-year long bond, and hundreds of other categorized securities.
How to use the Z-point system with ETFs…
Remember, the Z-point is the signal that indicates a market reversal, large or small, up or down, is about to take place.
So if the Z-point indicates the market, commonly represented by the S&P 500, is turning bullish – about to go up…
What would be the easiest and smartest way to play it, without having to pick and choose individual stocks?
Buy an ETF that tracks the S&P 500.
I recommend SPY (that’s its ticker symbol), the oldest and largest S&P 500 ETF out there – and with the most liquidity.
But what if the Z-point indicates that the market is reversing to the downside – that the stock market is about to decline, or worse, crash?
Well, what do many experienced investors do in that case?
They move their money into U.S. Treasuries, typically the 30-year long bond – recognized throughout the world as one of, if not the safest, investment you can own.
And there’s an ETF that does an excellent job of tracking the 30-year long bond. Ticker symbol: TLT.
So the Z-point strategy to use with ETFs couldn’t be easier or simpler.
You don’t use risky options.
You don’t use risky leverage.
You don’t use a risky margin account.
In other words, the Z-point ETF strategy is as safe and conservative an investment play as you’re ever likely to find – and it could certainly be one of the most profitable.
When the Z-point signals that the S&P 500 is about to go up…
You buy SPY, a proxy for the over all stock market.
If the Z-point signals that the market is about to reverse, and go down…
You sell SPY, and buy TLT, a proxy for 30-year U.S. Treasuries.
That way you’re always invested.
And you’re always ready to profit no matter which way the market moves!
The following charts illustrate this perfectly.
In the first chart, had you bought SPY @ $121.31 on May 31, 2011, for example… and held on to it until May 31, 2013 – selling it @ $153.86…
You could’ve realized a gain of 26%. Pretty good, right? Nothing to complain about.
S&P 500 ETF (SPY) 2011-2013 Buy and Hold
But now look at would you could’ve made using the Z-point system…
Z-Point Signals 2010-2012
Move from SPY Into TLT Just Before the Drop!
Had you bought SPY @ $113 on September 18, 2010, just like above – but sold it on July 1, 2011 @ $134 – when the Z-point indicated the market was about to reverse…
And bought TLT @ $93 – and then sold it @ $116 on November 12, 2011 – when the Z- point indicated the market was about to reverse again…
And bought SPY @ $126… and sold it on March 31, 2012 – just like in the buy and hold strategy…
Your cumulative gains could’ve been 55%
That’s more than double what you would’ve made buying and holding SPY through all the market reversals the Z-point had caught!
Talk about perfectly timing the market!
I could give you plenty more examples.
How simply buying and selling SPY and TLT using the Z-point system could lift your gains far above what you would otherwise make following a buy and hold strategy.
But now I want to show you how the Z-point system could put your portfolio into serious, mind-blowing overdrive.
I’m talking about triple-digit gains…
When buying and holding a stock would’ve handed you a loss!
And it’s especially effective now – in this crazy volatile market.
So here we’re going to use the Z-point system to indicate when to buy and when to “short” any of your favorite stocks so you could multiply your profits.
And it’s just as easy as buying and selling SPY and TLT.
Let me show you…
In the beginning of this presentation I told you how much money you could’ve lost <-10.93%>…
Had you bought shares of Boeing, and held on to them for one year, from March of 2001 thru March of 2002.
Boeing 2001-2002 Buy and hold
Now, here’s the chart showing you what you could’ve made buying and shorting shares of Boeing each time the Z-point system indicated the market was about to turn…
Boeing March 2001 - March 2002 With Z-Point
Had you initially bought Boeing @ $53.55 on March 24, 2001 – and sold it on May 26, 2001 @ $63.50 – when the Z-point indicated the market was about to reverse…
And then shorted Boeing @ $63.50…
Then covered your short (buying back your short) on October 20, 2001 @ $33.80 – when the Z- point indicated the market was about to reverse again…
While at the same time buying Boeing shares again @ $33.80…
And finally selling Boeing, on March 16, 2002 @ $48.27 – just like in the buy and hold strategy…
You could’ve earned yourself a sweet 108.16% gain – more than doubling your money!
Instead of suffering a 10.93% loss.
So in a nutshell…
If you want to avoid losses – and make far more money than what a buy and hold strategy can offer you…
Use the Z-point system!
And apply this easy, simple strategy of buying, selling and shorting your favorite stocks when the Z-point indicates the market is about to reverse, up or down!
But you need more proof of how well the Z-point system works, don’t you?
Of course you do!
So here’s chart after chart explicitly showing you how much money the Z-point system could help you earn.
First, let’s look at AIG, which I also mentioned at the beginning of this presentation.
And if you recall, I showed you its chart if you used a buy and hold strategy.
AIG April 2009 - April 2010
It could’ve earned you a very respectable 85% gain.
But here’s how, using the Z-point system, you could’ve captured a dazzling 226% gain over the exact same time period…
AIG April 2009 - April 2010 With Z-Point
Had you initially bought AIG @ $14.12 on April 4, 2009 – and sold it on October 17, 2009 @ $35.30 – when the Z-point indicated the market was about to reverse…
Then shorted AIG @ $35.30…
And covered your short on January 16, 2010 @ $19.77 – when the Z- point indicated the market was about to reverse again…
While at the same time going long AIG @ $19.77…
And finally selling AIG, on April 3, 2010 @ $26.15…
BINGO!
You could’ve earned yourself a 226.26% gain – instead of a 85.19% gain buying and holding.
And I can give you example after example of how much more money you could make using the Z-point system.
Let’s use another Blue Chip company, Bank of America (Ticker: BAC)
Using a buy and hold strategy…
Had you bought BAC @ $29.25 on October 23, 1999, and held it until June 10, 2000 – selling it @ $28…
You would’ve lost money! You would’ve been down 4.46%
Again, not much of a loss, but still a loss – and who wants to lose money — do you?
BAC October 1999 - June 2000 Buy and Hold
So now look at would you could’ve earned using the Z-point system…
BAC October 1999 - June 2000 With Z-Point
Had you initially bought BAC @ $29.25 on October 23, 1999 – and sold it on November 20, 1999 @ $32.19 – when the Z-point indicated the market was about to reverse…
Then shorted BAC @ $32.19…
And covered your short on April 15, 1999 @ $24.97 – when the Z- point indicated the market was about to reverse again…
While at the same time going long BAC @ $24.97…
And finally selling BAC, on June 10, 2000 @ $28…
HELLO!
Do you know what a 10-bagger is?
It’s when you make ten times your money.
Which is what you would’ve earned compared to your 4% loss.
You could’ve captured a gain of 44.61%.
Granted, it’s not a triple-digit gain, but it sure as hell beats losing money!
Which is precisely what you would’ve done using a buy and hold strategy – lost money!
Another example of scoring a 10-bagger using the Z-point system…
And we’ll use Warren Buffett’s company, Berkshire Hathaway (Ticker: BRK-B)
Using a buy and hold strategy…
Had you bought BRK-B @ $61.24 on June 24, 2006, and held it for 3 years, until October 17, 2009 – selling it @ $66.46…
Big whoop – you would’ve gained a measly 8.52%
Berkshire-Hathaway 2006-2009 Buy and Hold
So now look at would you could’ve earned using the Z-point system…
Berkshire-Hathaway 2006-2009 With Z-Point
Buying BRK-B @ $61.24 on June 24, 2006 – and sold it on January 12, 2008 @ $88.56 – when the Z-point indicated the market was about to reverse…
Then shorted BRK-B @ $88.56…
And covered your short on April 4, 2009 @ $60 – when the Z- point indicated the market was about to reverse again…
While at the same time going long BRK-B @ $60…
And finally selling BRK-B, on October 17, 2009 @ $66.46…
Another 10-bagger!
You would’ve made 10 times more!
You would’ve captured a gain of 87.63%
Now, let me quickly show you a few triple-digit winners you could’ve bagged using the Z-point system.
Let’s use Google this time.
Using buy and hold – buying Google in June 2006 @ $203.38 and selling it three years later in October 2009 @ $276.35…
You could’ve earned 35.88%. Nothing special, considering you sat on it for 3 years.
Google 2006-2009 Buy and Hold
But using the Z-point system…
Look at the chart…
Google 2006-2009 With Z-Point
You could’ve walked away with more than 5-times your money.
A gain of 154.32%
Just by buying and selling Google’s shares every time the Z-point indicated the market was about to reverse.
Tell, me what’s better than making money?
Making more money, of course!
Now let’s use Netflix (Ticker: NFLX) as an example.
Using buy and hold – buying NFLX in September 2010 @ $20.29 and selling it in March 2012 @ $16.40…
Whoops! Sorry. You would’ve lost a lot of money! Down 23.72%
Netflix 2006-2009 Buy and Hold
But using the Z-point system…
Look at the chart…
Netflix 2006-2009 With Z-Point
You could’ve walked away with a jackpot 192.92% gain!
Just by buying and selling NFLX shares every time the Z-point indicated the market was about to reverse.
Now let’s use CitiGroup (Ticker: C)
Using a buy and hold strategy – buying C in January 1998 @ $223.52 and selling it in June 1999 @ $305.96…
You could’ve earned 36.88%. Respectable, considering you held it for roughly a year and a half.
Citigroup 2006-2009 Buy and Hold
But by using the Z-point system…
You could’ve walked away with far more than just a respectable gain.
Look at the chart…
Citigroup 2006-2009 With Z-Point
You could’ve walked away with a downright fantastic gain of 124.66%.
Again, just by buying and selling C shares every time the Z-point indicated the market was about to reverse.
The charts speak for themselves…
Now for Cisco…
Buying and holding Cisco over a three-year period – a paltry gain of just 23.36%
Cisco 2006-2009 Buy and Hold
But buying and selling Cisco using the Z-point system…
Cisco 2006-2009 With Z-Point
You could of packed away a 107.46% gain – more than doubling your initial investment.
Okay, ready to go to Disneyland?
Let’s do it…
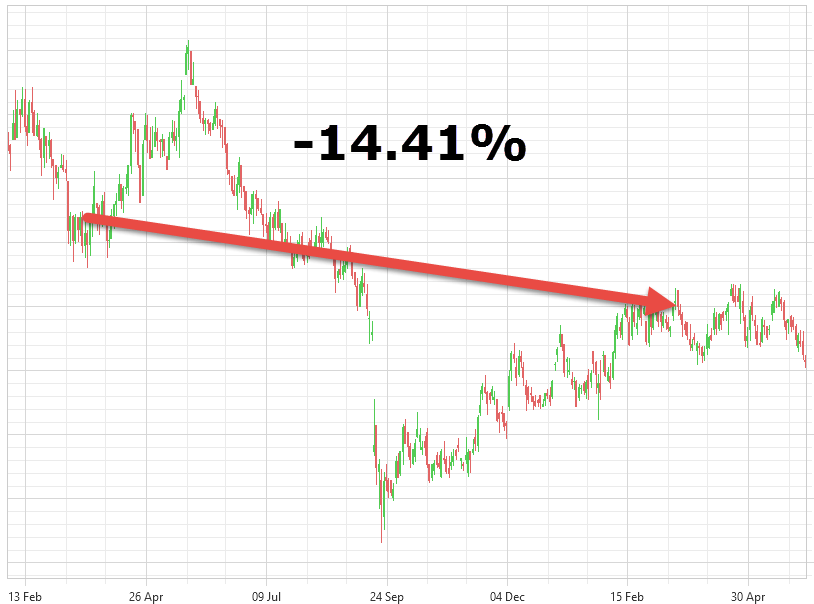
When buying and holding shares of Disney – you would’ve lost money.
You would’ve been down 14.41%
Disney 2006-2009 Buy and Hold
Buying and selling Disney using the Z-point system…
Disney 2006-2009 With Z-Point
Say hello to Mickey and Minnie. You could’ve walked away with a 91.82% gain!
Now for Microsoft…
Buying and holding Microsoft for three years – you would’ve made a pitiful 16.95%
Microsoft 2006-2009 Buy and Hold
Buying and selling Microsoft using the Z-point system…
Microsoft 2006-2009 With Z-Point
Ding, Ding, Ding! You would’ve hit the Jackpot again. A gain of 141.22%!
Since we’re already in the technology sector… let’s do Intel.
Buying and holding Intel…
Oh no! That’s a capital mistake!
You would’ve taken a big, BIG hit. You would’ve lost 31.59% of your investment!
Intel 2006-2009 Buy and Hold
But… buying and selling Intel using the Z-point system…
Intel 2006-2009 With Z-Point
Ah, that’s much, much better!
Instead of a massive loss… you could’ve had a massive gain. A gain of 77.49%!
And what might’ve happened had you bought QQQ – the ETF that’s a proxy for the entire technology sector.
Let’s see…
Buying and holding QQQ – Ouch!
You would’ve lost more than half your money! You would’ve been down 61.31%
NASDAQ 100 2000-2001 Buy and Hold
Not to worry though… had you bought and sold QQQ using the Z-point system…
NASDAQ 100 2000-2001 With Z-Point
How sweet it is! You would’ve scored a gain of 86.78%!
Ok, last one…
Goldman Sachs.
Buying Goldman Sachs in June 2006, and selling it three years later in October 2009…
You could’ve earned 24.13%. Again, nothing special, considering you sat on it for 3 years.
Goldman Sachs 2006-2009 Buy and Hold
But by using the Z-point system…
Look at the chart…
Goldman Sachs 2006-2009 With Z-Point
You could’ve walked away with more than 5-times your money.
A gain of 135.81%
Just by buying and selling its shares every time the Z-point indicated the market was about to reverse.
Face it… without the Z-point system protecting you, guiding you – you’re at the complete mercy of the markets.
Worse, you’re trading blindfolded.
The Z-point system gives you eyes that could see into the future – information that’s absolutely essential to your investing and trading success!
And I want you to have the Z-point system… before I unveil it to the wider investing public.
In short, I invite you to be a Z-point system “beta-tester.”
That way you can use the Z-point system starting today…!
Now the whole point of inviting you to be a beta-tester is so I can get your honest feedback on how well it works for you… how much money it helped you save… and how much money it helped you make!
Now I haven’t put a formal price on the Z-point system – which, by the way, it will be marketed under the name The Smart Money Indicator.
So let’s start calling it that right now.
But regarding its eventual price…
I have another investing aid, a service that’s already on the market.
It retails for $5,000 – and deservedly so.
In a poll recently conducted, 97.7% of its subscribers confirmed it’s helping them make money!
Helping them increase their net worth!
I expect no less from The Smart Money Indicator.
Therefore, in all likelihood The Smart Money Indicator will be priced similarly when it’s officially launched.
But because I’m inviting you to participate in The Smart Money Indicator pre-launch as a beta-tester, I’m only asking you to pay a small “commitment fee.”
Now why would I ask you, as a beta-tester, to pay anything at all?
The simple truth is – and this has been proven time and time again –when giving away something for free – especially online – the person receiving it places little to no value on it.
Which is completely natural and understandable.
If there’s no price attached; there’s no value attached.
Furthermore, if it carries no dollar value…
People tend to ignore it, forget about it – and in this case, because it’s a service – to never use it!
Which, of course, defeats the whole purpose of the beta-testing period.
In other words, you’re far more likely to commit to using The Smart Money Indicator if you pay something for it – even if it’s only a small token payment.
So why do I want YOU to use it in the first place?
Obviously, because it could help you make more money than you’re currently making – and do so with little to no effort!
After all, when predicting when stocks could go up and when stocks could go down…
The Smart Money Indicator is 86% accurate!
Plus, aside from helping you make more money – The Smart Money Indicator could also prevent you from losing money!
And who wants to lose money?
It’s Warren Buffett’s rule #1 as an investor.
Don’t lose money!
Because, obviously, you can’t make money if you’re losing money!
And that’s what The Smart Money Indicator could help you do.
Make more money not lose money!
And… if The Smart Money Indicator helps you make more money…
Hopefully, you’ll provide me with a testimonial stating exactly that – that it’s helped you make more money.
Because, for me to successfully market The Smart Money Indicator when it’s officially launched…
I’ll need testimonials confirming its effectiveness.
Confirming everything I’ve told you about it is absolutely the God’s honest truth!
Of course, that doesn’t mean I can’t give you something for FREE!
Not as a bribe for a positive testimonial…
But simply as an inducement to get you to actually use The Smart Money Indicator.
So…
Remember that “other service” I told you about that sells for $5,000?
Where 97.7% of investors who use it report it’s helped them make more money?
Well, if you're among the first 200 people to enroll in the beta-test program for the Smart Money Indicator...
You'll get to use it for FREE!
It’s called Portfolio Boss.
And it’s the perfect complement to The Smart Money Indicator.
Portfolio Boss is an automated trading platform like none you’ve ever seen before.
It’s sort of like an ATM. You punch a few buttons…
And voila!
Money practically comes flying out!
Just like The Smart Money Indicator, Portfolio Boss uses algorithms – this time though to pick the best stocks for you based on the filters you select, or the pre-set filters (stock selection strategies) included in Portfolio Boss.
But please…
DO NOT make the mistake of thinking Portfolio Boss is just a stock screening tool.
Calling it a stock-screening tool is like calling a Tesla a battery on four wheels.
It’s so much, much more.
For example…
Once it's activated and running in the background, constantly scouring he market - it will actually alert you when it's found stocks and/or ETFs that are a match.
Not only that… it actually alerts you when to buy them… and when to sell them.
And that is so, so useful. Because you know the hardest thing for any investor to do is sell a stock you own – even when you know you absolutely should.
Well, Portfolio Boss takes that dread, that paralyzing consideration out of your hands and makes the decision for you.
Of course, you don’t have to listen if you don’t want to.
But keep in mind…
97% of investors using Portfolio Boss made money with it.
Portfolio Boss can also be set up to text or email you every evening with the stocks that on that day are a best match.
And, just to be sure the filter strategy is a winner for you…
You can back test those filters, going back 20 years, to see how they performed in the past.
In short, Portfolio Boss makes investing dumb as a rock simple.
Plus, if Portfolio Boss picks too many potential winners (a nice problem to have, right?) simply dial it down to however many stocks you want to consider.
And if you’ve only got so much money to invest in these top picks…
Portfolio Boss calculates how many shares of each stock to buy.
Impressive, right?
But wait…
Now here’s an even better deal for you!
First, I should tell you that Portfolio Boss is a Windows-based program.
So if you have a Mac you can still use it but you’ll need to install Windows first.
There are many ways to do this, just Google: “how do I install Windows on my Mac.”
OK, so here’s the better deal...
Because I want to make Portfolio Boss as easy as possible for you to use…
Included in Portfolio Boss are quick start video tutorials.
But…
To also show you my deep appreciation for you being among the first 200 people to subscribe to The Smart Money Indicator as a beta-tester…
You will also receive a private phone number to call to speak to one of my super-friendly staff members – who will personally show you, 1-on-1, how to use Portfolio Boss.
Normally, this customized 1-on-1 service costs $200.
But as I said, if you’re among the first 200 people to subscribe to The Smart Money Indicator as a beta-tester you’ll get this service for FREE!
Now you have to admit… this is a great offer!
You get to subscribe to The Smart Money Indicator for a small commitment fee as a beta-tester.
Which if you wait till the service is formally launched – it could cost you a few thousand dollars at a minimum.
(But I’ll be eager to hear what you think this service should cost.)
You’ll also get access to Portfolio Boss for FREE if you're among the first 200 subscribers!
And you’ll also receive personalized 1-on-1 assistance setting up Portfolio Boss – a $200 value.
So right then and there you’re receiving up to $5,200 worth of services when you subscribe to The Smart Money Indicator!
Multiply $5,200 by 200 subscribers and you can see how I'm taking over $1,000,000 out of my pocket - just to reward you for being among the first 200 subscribers to use The Smart Money Indicator!
Now you probably have 2 questions…
As a beta-tester, what is the subscription fee for The Smart Money Indicator?
And what exactly do you receive as a subscriber to The Smart Money Indicator?
I’ll answer the last question first.
The Smart Money Indicator is as simple a service as you will ever find.
I won’t bore you with monthly market commentary that you’re probably already reading somewhere else for free.
And I won’t bore you with a litany of reasons why this or that stock might be a good investment for you.
Because The Smart Money Indicator is not a stock picking service.
It doesn’t recommend stocks to buy, or for that matter sell.
Portfolio Boss, on the other hand, does that for you with a few clicks of your mouse.
Which is why it’s the perfect complement for The Smart Money Indicator.
So what do you get with The Smart Money Indicator?
Whenever The Smart Money Indicator determines that the S&P 500 is about to change course – to reverse direction – up or down…
You’ll get an email alert from me telling you exactly that.
If The Smart Money Indicator indicates the market is about to go up…
You’ll be alerted that now could be the best time to increase your position in stocks or ETFs you already own, or establish a position in those stocks or ETFs you don’t yet own.
If The Smart Money Indicator indicates the market is about to go down…
You could either choose to sell your stocks, short stocks, or just hedge your portfolio by purchasing TLT, the ETF for the 30-year U.S. Treasury bond.
Or use any other investment vehicle, or combination of vehicles, that you feel is proper and suitable for you.
Just like you rely on the weather report to tell you if it’s going to be hot or cold, rainy or sunny…
The Smart Money Indicator is your weather report for the stock market.
But unlike a weather report – it’s been 86% accurate – and has been for the past 30 years!
In other words, The Smart Money Indicator gives you the awesome power to make the right investment decisions at the right time.
To help you capture double and triple-digit gains!
While at the same time helping you avoid painful double-digit losses!
Like I already showed you…
With The Smart Money Indicator at your side you could’ve scored a gain of 192.92% with Netflix instead of a 23.72% loss buying and holding.
Neftlix using The Smart Money Indicator: a 192.92% gain!
Netflix when just buying and holding: a 23.72% loss!
The same story would’ve happened with the technology ETF QQQ:
With The Smart Money Indicator at your side you could’ve scored a gain of 86.78% with QQQ instead of a crushing 61.31% loss buying and holding it.
QQQ using The Smart Money Indicator: a 86.78% gain!
QQQ when just buying and holding: a 61.31% loss!
Boeing and Disney – same thing!
Boeing using The Smart Money Indicator: a 108.16% gain!
Boeing when just buying and holding: a 10.93% loss!
Disney using The Smart Money Indicator: a 91.82% gain!
Disney when just buying and holding: a 14.41% loss!
Which begs the question: why in the world would anyone invest without using The Smart Money Indicator?
It wouldn’t make any sense not to!
Now to answer the first question…
As a beta-tester… how much will a 1-year subscription to The Smart Money Indicator and Portfolio Boss run you?
You probably already have an idea.
But you’re also probably way, way off.
As a beta-tester you’ll pay only $99 for both The Smart Money Indicator and Portfolio Boss!
That’s all.
But that’s not really all…
Become a beta-tester and you’re guaranteed to get every penny back of your $99 subscription fee…
If The Smart Money Indicator doesn’t protect your portfolio from future stock market reversals…
If The Smart Money Indicator doesn’t help you make far more money using it than if you don’t.
And if you’re not satisfied with The Smart Money Indicator for any other reason – any reason whatsoever…
And you don’t even have to give me the reason (but I surely would appreciate it if you would, even though it’s not required)…
You will receive a prompt, courteous, full and complete refund of your $99.
Which begs another question:
How long can you test The Smart Money Indicator and still get a full refund if you’re not completely 100% satisfied?
The answer: 1 full year!
That’s right! You can use The Smart Money Indicator for a full year after you subscribe – and if 364 days later you want your $99 back.
You will get your $99 back! Period.
But whatever you decide.
Do not get caught unprepared for this next upcoming market reversal!
If you’ve been on Yahoo Finance, Bloomberg, MarketWatch and any other financial website recently…
You know the talking heads are expecting the market to reverse.
Unfortunately, they don’t know when and there’s no agreement on which direction!
Crazy, I know!
But that’s the type of information you get when you get it for free.
Opinions have no value. They offer no help, no insight.
The Smart Money Indicator is based on fact – on the COT report and the algorithms I have put in place.
Furthermore, because you’re now seeing unprecedented volatility in the stock market…
One reversal quickly followed by another…
It’s absolutely critical that you keep The Smart Money Indicator close by your side.
Normally, significant reversals can happen up to five times a year.
Then there are the innumerable minor reversals that happen between the big ones.
Those aren’t as impactful or critical to your investing health.
So typically I won’t drive you crazy sending you alerts for those.
But through the Smart Money Indicator… I will let you know when the next big one is forming and about to strike.
And wouldn’t you know it…
The Smart Money Indicator is actually seeing some “clouds” forming right now.
Just clouds mind you.
Not enough to trigger an alert just yet.
I’m waiting for absolute solid confirmation that this could turn into a significant money-making reversal.
Now that confirmation could arrive later today, tomorrow or next week.
But it’s always better to be safe than sorry.
So become a beta-tester now – Today!
Protect your portfolio – and get yourself ready to make some serious, serious money!
Thank you for your time.
I am at your service,
Dan Murphy
Founder of The Smart Money Indicator
To become a beta-tester for The Smart Money Indicator please click the subscribe button below: